Calculating Retail Site Suitability and Trade Areas
- Yayin Cai
- Mar 11, 2018
- 4 min read
Geospatial analysis could help answer the question: "where?" Here I use ArcGIS to show how to calculate retail site suitability and trade areas for a proposed mall-Post@Modern. Basically, we have two methods for understanding the market potential. The first is to build a site suitability map of consumers in census tracts who are more likely to make the trip to the new development and use that to weight the population figures of the tracts. The second is a simple "Huff Model", which is similar in nature and asks "considering both distance to Post@Modern, distance to local competitors in their area, and the square footage of existing developments, what is the probability a consumer will make the trip to Post@Modern".
Method 1: Travel Potential
I use three factors to calculate the travel potential: transportation factor, income factor and employment factor. For transportation factor, I use three sub-factors, road density, high way density and distance to regional rail stations. The other two important factors are median income by census tract, and distance to major employment centers. The median income indicates the purchase power of people, which is highly correlated with the likelihood of shopping to the mall. Major employment centers are related to those possible customers who have income and might go shopping.
Generally, the transportation factor is regarded as the most important factor. Income factor is also vital. In contrast, employment factor is not that important, since people who work here may live far away. So I give transportation, income and employment factors the weight of 3, 2, and 1.5 respectively. All the factors and sub-factors are reclassified to scale 1 to 5. For 1, it indicates the least potential of this factor, and for 5 it indicates the most potential of the factor. For example, 1 in road density means the least accessibility on street level, and 5 in median income indicates the census tracts which have highest census tracts. Then, I use raster calculator to calculate the final travel potential for the whole region. I reclassify the raster from 1 through 10 and reverse the order, so that 10 is the lowest travel potential and 1 is the highest. The classification method is quantile.
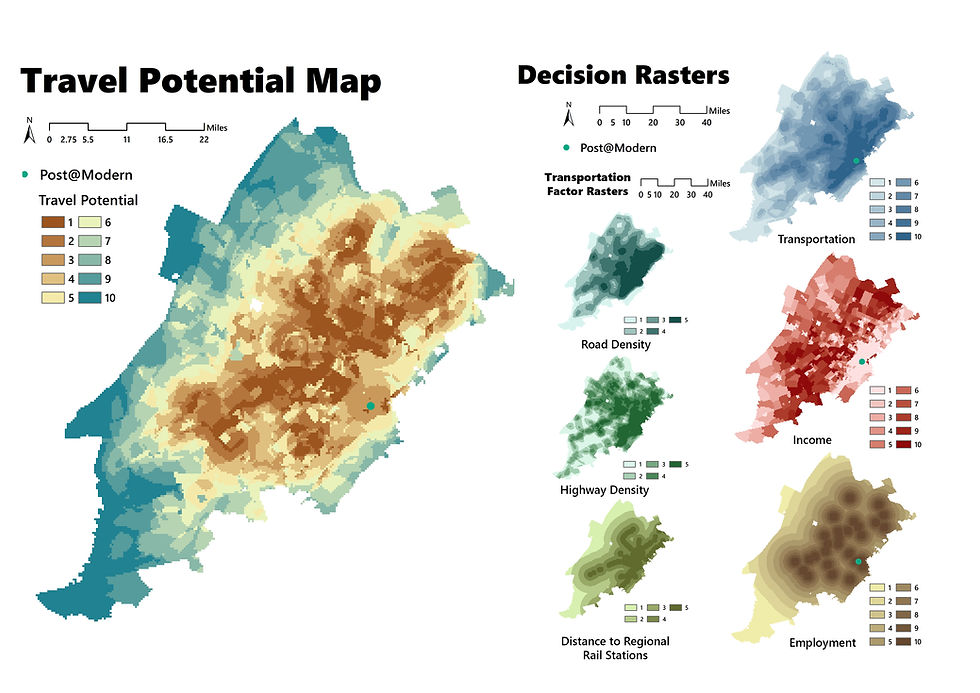
The weighted population indicates the customer potential. Theoretically, all people in the region could be the potential consumers to the mall. Actually, the larger “anti suitability“ travel potential is, the less likely people will go shopping, otherwise the more likely people will go shopping. For example, in a census tract which enjoys good transportation connection and has relatively higher median income, as well as is close to major employment centers, people are more likely to go shopping in the mall. So the travel potential indicator could be very small (assumed to be 1), and weighted population will be the same as population, which means that all people in the census tract could be potential customers.
The scatter plot shows the relationship between weighted population and median income, getting rid of the very wealthy group (median income more than 125k). Generally, the weighted population and median income are positively correlated. According to the scatter plot, in the census tract where the median income is higher, the potential customer share is higher as well. So the mall could target at the customers who have relatively high income and good purchase power. But the analysis doesn’t take into consideration the location and the size of the mall and the competitors.

Method 2: Consumer Probability
Another method is taking into consideration the potential competitors and the gross leasable area of them. The formula to calculate consumer probability is as follows:
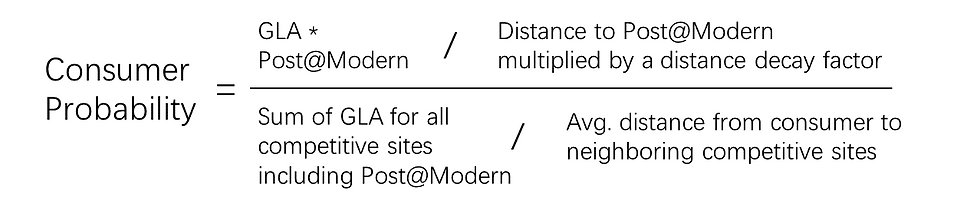
Setting the distance decay factor to be 2, the consumer probability could be calculated:
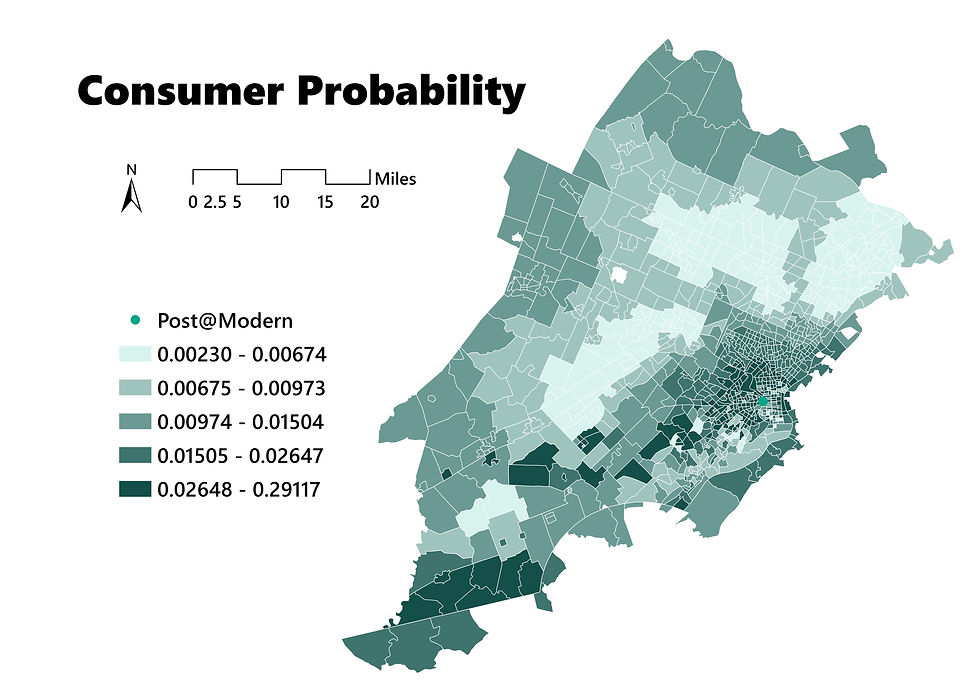
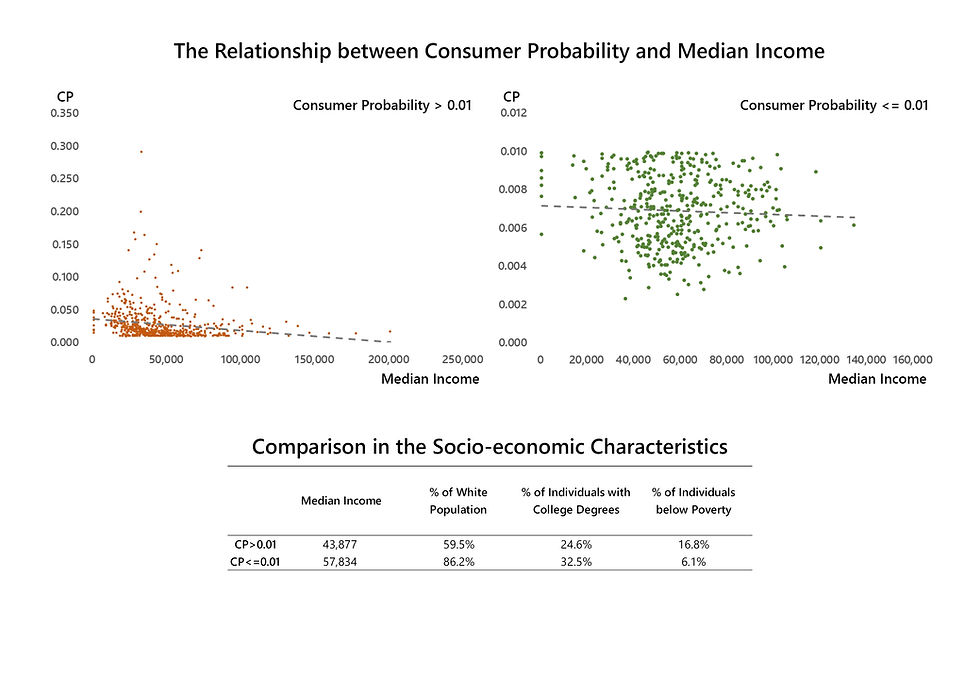
I use 0.01 to cut off the consumer probability, which identify the consumer probability above 0.01 as “highly likely to go the mall frequently“. According to two scatterplot, the consumer probability is generally negatively correlated with median income. In addition, as shown in the table, those census tracts whose consumer probability is no more than 0.01, have higher median income, higher proportion of white population, higher percentage of individual with college degrees and lower poverty rate. The results show that Post@Modern is more likely to attract mid-low income individuals and families.
When taking consideration of competitors in the region, it suggests that the mall is more likely to attract those mid-low income individuals and families. So, it is better for the mall to mainly sell cheap products, such as fast-moving consumer goods. But for fast-moving consumer goods, the substitutability is very high. Customers might go to other malls instead of Post@Modern. Under the circumstance, Post@Modern is hard to become the regional shopping hub, failing to reach its initial goal. Another idea is to change the target potential customers. The model is based on the assumption that the major competitors of Post@Modern are Wal-mart, Outback Steakhouse, Gap, Best Buy and other small retail businesses. If Post@Modern sell the products that are exclusive sold in the region, it is likely to become competitive as well. Therefore, the developer might consider rethink the potential market the mall is going to target at. For example, for some goods like cars, jewery, luxury brands, and farm tractors, there might not be too many retail stores selling these products in the region. But it requires more market research, since the competitors will change if the potential customers are changed.


